[et_pb_section fb_built=”1″ _builder_version=”3.19.5″ custom_margin=”-113px||0px” custom_padding=”0|0px|0|0px|false|false” collapsed=”off”][et_pb_row custom_padding=”0|0px|27px|0px|false|false” _builder_version=”3.19.5″ link_option_url=”https://www.vaneyepes.com”][et_pb_column type=”4_4″ _builder_version=”3.0.47″ parallax=”off” parallax_method=”on”][et_pb_image src=”https://www.vaneyepes.com/wp-content/uploads/logo-vaneyepes.png” url=”https://www.vaneyepes.com” align=”center” force_fullwidth=”on” _builder_version=”3.19.5″]
[/et_pb_image][/et_pb_column][/et_pb_row][/et_pb_section][et_pb_section fb_built=”1″ _builder_version=”3.19.5″ custom_margin=”||” custom_padding=”50px|0px|54px|0px|false|false”][et_pb_row custom_padding=”0|0px|27px|0px|false|false” _builder_version=”3.19.5″][et_pb_column type=”3_5″ _builder_version=”3.0.47″ parallax=”off” parallax_method=”on”][et_pb_image src=”https://www.vaneyepes.com/wp-content/uploads/PapaGraph.png” _builder_version=”3.19.5″ custom_padding=”0px|0px|0px|0px|true|true” custom_padding__hover_enabled=”on” custom_padding__hover=”0px|0px|0px|0px”]
[/et_pb_image][et_pb_text _builder_version=”3.19.5″]
[/et_pb_text][/et_pb_column][et_pb_column type=”2_5″ _builder_version=”3.0.47″ parallax=”off” parallax_method=”on”][et_pb_post_title author=”off” date=”off” comments=”off” featured_image=”off” _builder_version=”3.19.5″ title_font=”||||||||” title_font_size=”28px” title_line_height=”1.4em” meta_font=”|700|||||||” meta_text_color=”#E02B20″]
[/et_pb_post_title][et_pb_text _builder_version=”3.19.5″ background_size=”initial” background_position=”top_left” background_repeat=”repeat” custom_margin=”|||”]
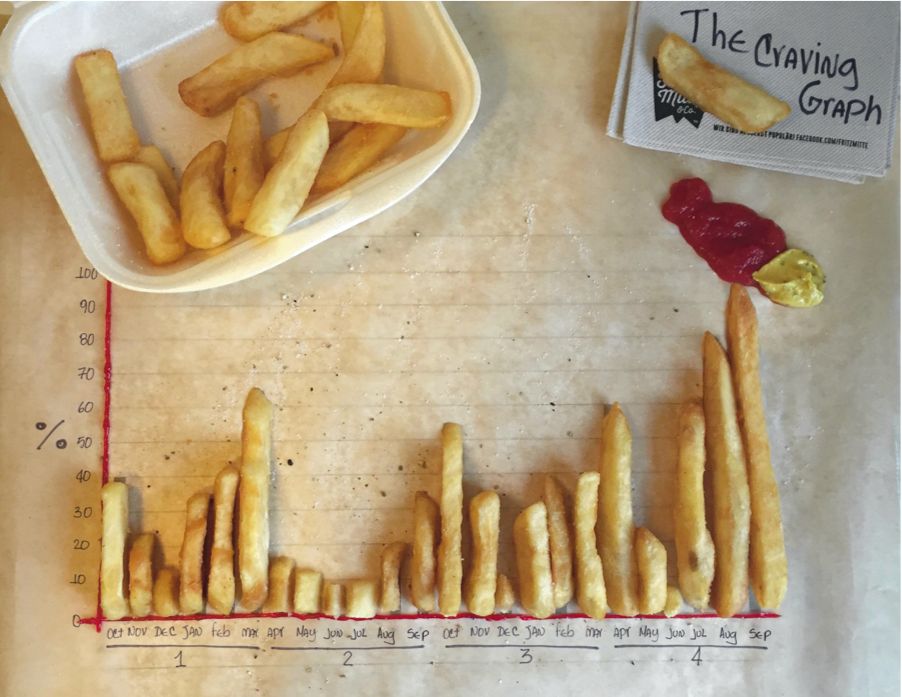
WE ARE ALL MADE OF DATA
Is everyday life measurable in an accurate way? If it is possible, what to do with this data? Keep records like diaries or journals has a useful purpose?
This project is an attempt to reconcile my technical education with experiences which aim no longer a practical functionality. With this subjective data visualization exercises, I intend to analyse parts of my daily life, comparing them with real statistics and creating infographics with objects of my every day.
[/et_pb_text][et_pb_image src=”https://www.vaneyepes.com/wp-content/uploads/Piechart2.png” _builder_version=”3.19.5″]
[/et_pb_image][et_pb_image src=”https://www.vaneyepes.com/wp-content/uploads/Bedmap.png” _builder_version=”3.19.5″]
[/et_pb_image][/et_pb_column][/et_pb_row][/et_pb_section]